 Premetz Analysis
The Premetz analysis method
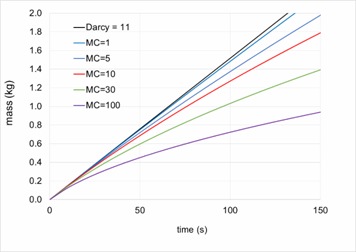
For melts containing inclusions, a “cake” builds up on top of the filter during the test, providing additional resistance to metal flow. Hence the weight versus time plot will deviate from the simple straight line for clean metal. The greater the level of inclusions, the greater the deviation. The Premetz method uses a process model to predict the metal flow through a fixed filter in series with an ever thickening cake.
The plot shows the sorts of Prefil curves expected as the inclusion level increases: in all these cases the filter itself has a fixed aluminium permeability of 11 darcy. Only the inclusion loading is changing in these tests, as quantified by the number MC.
The Metal Cleanliness number (MC)
MC is a parameter arising in the process model:
- it is proportional to the volume fraction of inclusions
- it is inversely proportional to the permeability of the inclusion cake.
The Prefil test measures the resistance to flow provided by the inclusion cake. Changes in flow either arise from changes in number of inclusions, or from inclusion type. Fine inclusions (e.g. borides and carbides) have a much bigger impact on flow than an equivalent volume fraction of coarse inclusions.
In general the parameter MC covers a convenient range of numbers easy to understand:
- MC ≈ 0 - 1 indicates an inclusion level is so low it can barely be detected by the test
- MC ≈ 1 - 5 indicates clean metal
- MC ≈ 5 - 30 indicates moderately clean metal
- MC > 30 indicates a high level of inclusions.
Broadly speaking,
- MC ~ 1 corresponds to a PoDFA level of <0.01mm2/kg, or a LiMCA value of 1 k/kg
- MC ~ 100 corresponds to a PoDFA level of ~1 mm2/kg, or a LiMCA value of 100 k/kg.
(this applies for samples not containing high levels of fine inclusions such as borides and carbides).
However the exact correlation depends on the details of the inclusion population.
A Prefil test file uploaded to the Premetz website is immediately analysed, determining both the permeability of the filter used, and more importantly, the MC value for that metal.
It also provides a chart showing the raw Prefil data, and the process model curve. The goodness of fit between the raw data and the process model is usually R2 > 0.9997.
Of course, Prefil also creates a solid residue containing the inclusions which can be analysed by the PoDFA method to determine the type of inclusions present to allow remedial action to be taken.